Value Multiple Benefits
The third step to accessing funding and financing options for nature-based storm resilience solutions is to value these strategies’ multiple benefits such as reduced flood risk, improved water quality, and enhanced recreation. Knowing the quantitative and qualitative value of these multiple benefits helps communities make the case for investing in nature-based solutions and helps align these projects with potential funding and financing options.
Click through the sections below to find a framework and methodology for quantifying and valuing the multiple benefits of storm resilience projects. Click here to download a PDF version of the framework.
Why Assess and Value Benefits of Storm Resilience Projects
The benefits associated with nature-based solutions are often referred to as ecosystem services. Ecosystem services reflect the benefits people receive from nature that are essential to human survival and economic prosperity. Ecosystem services can be valued and incorporated into comprehensive benefit cost analyses or triple bottom line (TBL) accounting frameworks that account for the full range of financial, social, and environmental benefits. When evaluating green infrastructure and other nature-based projects and programs, this information can be valuable for several reasons, including:
Identifying infrastructure alternatives design elements that maximize community value
Accounting for the full range of ecosystem service benefits associated with green infrastructure and other nature-based solutions avoids decisions in which these values are discounted or not valued at all. Monetizing these benefits (when appropriate and feasible to do so) allows for an apples-to-apples comparison of benefits and costs. This helps practitioners and decision-makers understand the tradeoffs or complementarities associated with different ecosystem service benefits and to discern which approach (or combination of approaches) will yield the greatest value for their community.
Building internal support for green infrastructure and nature-based solutions
In some cases, municipal staff or departments may not be familiar with nature-based approaches as an alternative to more traditional infrastructure projects. Quantitative information on benefits can inform internal discussions during project development and planning stages.
Competing for scarce funding
In many areas, municipal departments must compete for funding with other important community programs. Grant funds from external sources are also often subject to competitive proposal processes. Demonstrating the full value of proposed projects can make them more competitive, particularly if they help to achieve multiple community priorities.
Ready to explore funding options? Jump to Step 4 to select priority funding opportunities.
Leveraging alternative funding sources
Information on benefits can be used to leverage alternative funding streams from both public and private sources. For example, information on public health and economic development benefits may leverage funding from public agencies that might not otherwise think about funding stormwater projects. Similarly, research related to private sector implementation of green infrastructure shows that property owners and developers would be willing to implement green infrastructure on their property if they knew it would improve their bottom line (e.g., through increased property values, retail sales, and/or rents).
Gaining support and buy-in from decision-makers and other stakeholders
Utilities and municipalities can use objective information on the benefits of green infrastructure and other nature-based solutions to gain support from upper management and other key decision-makers. This information can also be useful in communicating the value of proposed projects to stakeholders, further broadening community buy-in.
How to Value Storm Resilience Project Benefits
This section reviews the types of benefits associated with green infrastructure and coastal resilience projects and provides some initial information about methods for quantifying and monetizing the value of these benefits.
To explore the multiple benefits of a specific GSI project, check out the Green Stormwater Impact Hub. The hub is an interactive platform with a suite of resources and tools to help quantify and communicate the multiple benefits – or co-benefits – of green stormwater infrastructure and assist in siting and planning projects to achieve the greatest impact. These resources include the GSI Impact Calculator, a tool designed to support stormwater practitioners, urban planners, policymakers, and community advocates in evaluating the benefits and costs of GSI. By highlighting the multifaceted advantages of GSI, including flood risk reduction, heat mitigation, water quality improvement, and job creation, the GSI Impact Calculator empowers stakeholders to make informed, strategic decisions during the early planning stages of stormwater and other infrastructure projects.
Flood Risk Reduction
Targeted GSI projects can reduce localized flooding associated with small to moderate storm events that inundate streets and cause sewer and basement backups (so-called “nuisance flooding”). Projects that provide natural barriers along the coast can reduce flooding associated with coastal rain events and wind-driven storm surge. Stream restoration projects and wide-scale distributed GSI (e.g., when integrated throughout a watershed) can alleviate riverine flooding associated with larger storm events.
Overview and key inputs
Increased flood resilience can reduce damage to property, infrastructure, and environmental amenities. It also reduces adverse health risks associated with exposure to flooding and basement backups, avoids emergency response and cleanup costs, and limits the economic impacts of street or business closures from flooding. The benefit of projects that reduce flood risk can be calculated based on the costs of these avoided impacts.
Federal agencies and others have developed well-established methods and tools for assessing avoided flood damages. These approaches are generally applicable to larger-scale riverine and coastal flooding and involve modeling to estimate the flood damage costs that will be avoided over the life of a project. Data on the depth and extent of flooding under various storm return intervals (e.g., 10-year, 100-year storm events) and information on the characteristics of the affected area (e.g., information on structures, businesses, land uses, population impacted) are necessary to run these models.
The benefits of projects that address localized or nuisance flooding can be more difficult to estimate. Smaller storm events may cause little flood-related damage without the project but can inconvenience residents and community members by causing unsafe conditions, road closures, and/or basement backups. Analysts have quantified the benefits of reductions in localized flooding based on WTP by households to avoid flood risk, avoided basement back up costs, or impacts on the value of properties affected by a flood risk reduction project. These methods require different inputs.
Another method for valuing the benefits of nature-based solutions for flood risk reduction is quantifying the avoided costs of alternative flood control options (e.g., managing flooding through gray infrastructure approaches). This method can be applied to projects that reduce larger scale flooding and flooding associated with smaller storm events.
Estimating benefit values
Avoided flood damages – projects that address larger scale flooding
The benefits associated with larger-scale riverine and coastal flood risk reduction projects can also be valued based on the flood-related damages that will be avoided over the life of the project. This method is appropriate to use when comparing the project to a “no action” alternative. Depending on the extent and severity of the flooding event, avoided damages may include structural damages to buildings, loss of building contents, damages to infrastructure or critical facilities, loss of wages and profits to businesses, emergency response costs, displacement, injury or loss of life, and post-flood cleanup costs.
To calculate avoided damages, practitioners must estimate and compare flood damages with and without the project. Key steps are outlined below:
Step 1: Define and inventory the area over which flooding will be mitigated
A floodplain inventory is needed to identify the types of buildings and other assets at risk. Key data requirements include size, population, property type, property values, and structure characteristics within the management area. This does not have to involve an extensive study – the US Army Corps of Engineers (USACE) developed and maintains the National Structure Inventory (NSI), a repository of structure point data containing building-level attributes in a GIS base layer that can be used for this purpose.
Step 2: Conduct hydrologic and hydraulic modeling.
The next step is to understand how the extent and depth of flooding will change with and without the proposed flood risk mitigation measures. This can require a rainfall-runoff (hydrologic) model to route rainfall over the landscape. A hydraulic model may also be needed to understand the performance of the stormwater and wastewater system during rain events. This cannot always be done in house and municipalities often hire consultants to perform this modeling.
Step 3: Estimate damages with and without project
Depth-to-damage functions are then used to translate the depth of flooding into physical damages, given the existing stock of buildings and their classification (e.g., residential, commercial, industrial classification codes), and nonphysical damages (e.g., emergency response, displacement, flood cleanup costs). The range of storm event return periods and their expected damage amounts are used to calculate expected annual damages across all storm event types. This process accounts for the probability of occurrence of different flood events. Damage estimates can be conducted using tools developed by USACE or FEMA that provide standardized relationships for estimating flood damages and other costs of flooding.
Avoided infrastructure costs
If the baseline scenario includes an alternative project for addressing flood risk reduction (e.g., through a gray infrastructure project), the costs of the avoided project can be included as a benefit of the green infrastructure or nature-based resilience project. Costs of the avoided project should include lifecycle costs – from design, construction, to maintenance over time. Costs should be calculated for the period over which the project would have been implemented for appropriate comparison in present value terms. Consideration should be given to the expected life of the avoided project. For example, if the nature-based resilience project has an expected life of 50 years (or is being evaluated over a 50-year period), and the avoided project has a useful life of 30 years, replacement costs (or decommissioning costs as relevant) incurred at the 30-year mark should also be included as an avoided cost.
For projects intended to manage larger-scale riverine or coastal flooding, these avoided costs may be best developed based on high-level engineering cost estimates (if available). For green infrastructure projects that address localized flooding, avoided costs can include the cost of managing stormwater runoff to local standards (e.g., MS4 permit requirements) using traditional gray infrastructure. For example, R.S. Means, a widely used database for construction cost estimating, reports capital/construction costs for managing a square foot of impervious area using traditional methods (i.e., underground storage and drainage networks). In 2024 USD, this value amounts to $3.68 per square foot of impervious area managed. Multiplying the impervious area managed with the green infrastructure project/nature-based solution by the unit value avoided cost ($3.68 per square foot) yields a total avoided cost benefit. This can be supplemented by local cost data for managing stormwater runoff within the public right-of-way. In addition, this is a onetime avoided construction cost; maintenance costs should also be estimated and included in the avoided cost estimate.
Importantly, the cost for managing stormwater runoff includes costs for meeting both volume and water quality based standards. Thus, if this approach is used to estimate the benefits of projects that reduce localized flooding, water quality benefits should not be separately evaluated.
Additional methods for estimating flood risk reduction benefits of projects
The types of flooding targeted by green infrastructure also does not always result in the types of damages captured in the models described above. Economists have developed alternative approaches for valuing flood risk reduction benefits associated with these projects. For example, researchers have used stated preference surveys to estimate the willingness to pay (WTP) of households to avoid street flooding, basement flooding, or basement backups. Across studies, household WTP ranges from $50 – $88 per year.
Others have used hedonic pricing methods to investigate the effect that flood risk has on housing prices. For example, several studies have found that the value of homes within the 100-year floodplain are 2% – 8% lower than equivalent homes outside the floodplain. Another study found that on-site retention to mitigate flooding can increase property values by 2% – 5% for properties located in the flood plain.
Local planning data or knowledge of flood damages can also be used to estimate project benefits. For example, if a green infrastructure or other nature-based project is implemented to address basement backups in a neighborhood, local knowledge can inform estimates on the frequency and number of basement backups that occur each year, as well as the costs associated with clean up. This can yield an order of magnitude estimate of the damages that will be avoided by the project.
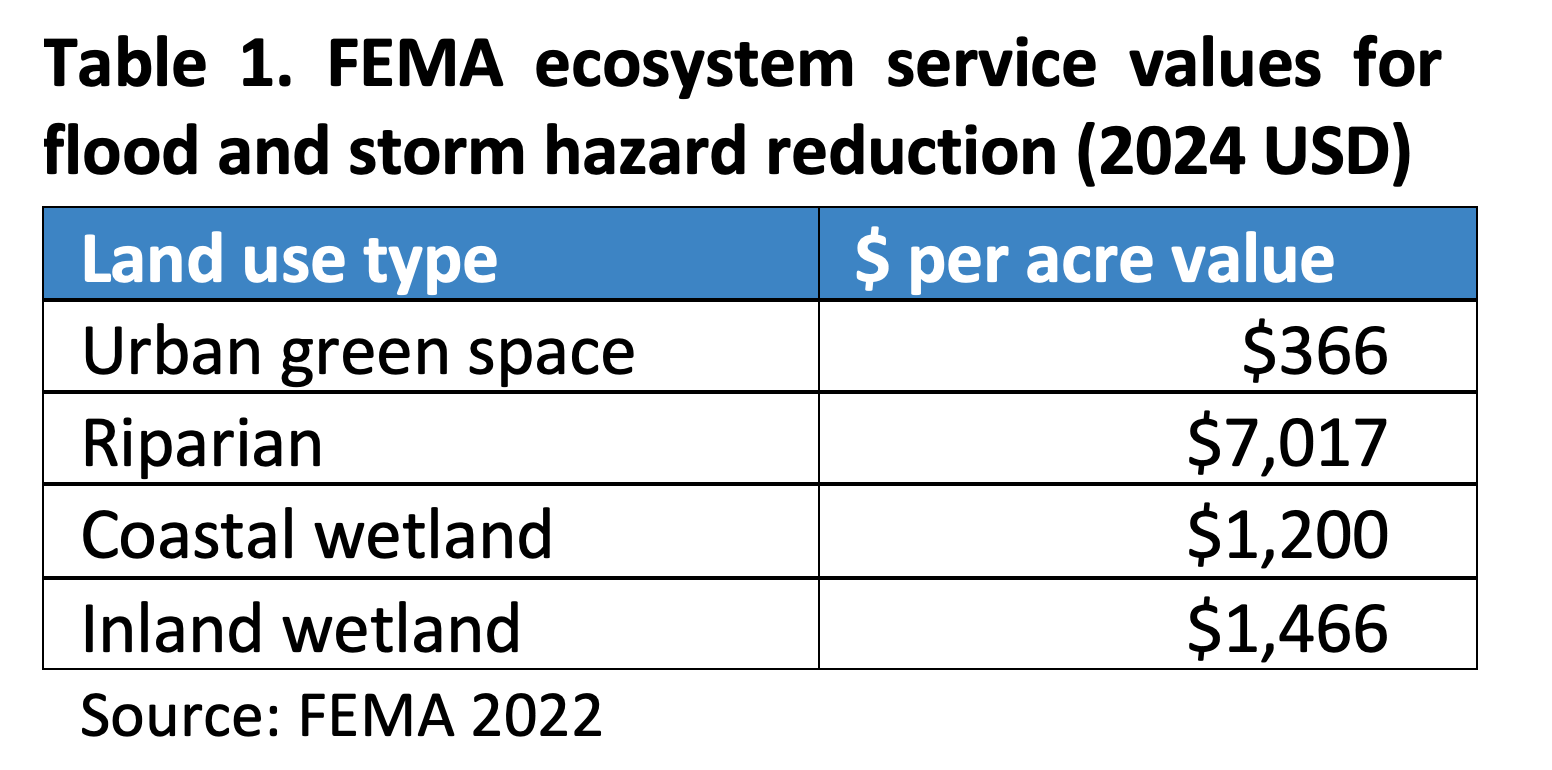
Finally, a simple way to estimate the flood risk reduction value of some nature-based practices is to rely on ecosystem service values developed by the Federal Emergency Management Agency (FEMA) for different land use types. Using benefits transfer and existing academic studies, FEMA estimates national average values for flood and storm hazard reduction for several applicable land use types (Table 1).
Resources and guides
Local planning documents and data can inform relatively simple calculations of flood risk reduction benefits. Additional resources include:
US Army Corps of Engineers National Structure Inventory (NSI) includes information about the location, type, and value of buildings and infrastructure.
Tools developed by the Federal Emergency Management Agency (FEMA) for estimating benefits of flood risk reduction projects: HAZUS, FAST, Benefit-Cost Analysis Toolkit, and Ecosystem Service Values.
Water Research Foundation (WRF) Green Stormwater Infrastructure Triple Bottom Line Tool (Green Infrastructure TBL Tool) is an Excel-based benefit-cost assessment tool that allows users to quantify the financial, social, and environmental benefits of green infrastructure solutions. The green infrastructure TBL Tool contains a module that allows users to estimate the avoided infrastructure costs associated with more traditional gray infrastructure projects for stormwater management, including projects that reduce flood risk and improve water quality.
Water Quality Improvements
Green infrastructure and other nature-based solutions can improve water quality by filtering or reducing the volume of untreated stormwater runoff entering storm sewer systems and local waterbodies. These projects can also reduce peak stormwater flows, which can cause streambank erosion, and in cities with combined sewers, can reduce overflows that discharge untreated sewage into local waterways. These benefits in turn can result in substantial water quality and related aquatic habitat improvements.
Overview and information needed
Like flood risk reduction benefits, water quality improvements from green infrastructure and other nature-based resilience projects can be estimated based on the avoided costs of alternative water quality treatment options. Avoided treatment costs depend on the pollutant load reductions resulting from nature-based projects, such as pounds of nitrogen, phosphorous, or total suspended solids (TSS) removed. Unit treatment cost values (e.g., $ per pound of pollutant treated at a wastewater treatment plant) can be applied to pollutant removal estimates to determine the value of total water quality benefits. When using avoided costs to estimate the water quality benefits of nature-based solutions, care must be taken to avoid double counting with any avoided infrastructure costs calculated as a flood risk reduction benefit.
The value of water quality improvements can also be estimated based on public WTP for higher quality rivers, streams, and lakes. Several studies have estimated WTP for water quality improvements in different contexts. These studies can provide relevant estimates for benefits transfer. Applying this method requires data on the baseline level of water quality, expected water quality improvements resulting from the project, and the scale of water quality improvements relative to water quality impairments within the local municipality/watershed.
Estimating benefit values
Avoided infrastructure costs
If the baseline scenario includes an alternative project for addressing water quality impairments, the costs of the avoided project can be included as a benefit of the green infrastructure or nature-based resilience project. Costs of the avoided project should include lifecycle costs – from design, construction, to annual maintenance. Costs should be calculated for the period over which the project would have been implemented for appropriate comparison in present value terms. Consideration should be given to the expected life of the avoided project. For example, if the nature-based resilience project has an expected life of 50 years (or is being evaluated over a 50-year period), and the avoided project has a useful life of 30 years, replacement costs (or decommissioning costs as relevant) incurred at the 30-year mark should also be included as an avoided cost.
Household willingness to pay for water quality improvements
The WRF green infrastructure TBL Tool allows users to calculate household WTP for water quality improvements. This method can be used to approximate the value of water quality improvements for an individual project by estimating how much the project contributes to overall waterbody health. It requires some judgement from the user to make reasonable assumptions related to key inputs; it is intended to provide a reasonable approximation of value associated with the average change in water quality and aquatic habitat across affected/target water bodies. Follow the steps below to estimate benefits to water quality:
Step 1: Determine level of water quality improvement in affected water body
The ten-point water quality ladder serves as the basis for measuring the water quality improvements that will result from a green infrastructure project. This in turn influences household WTP for those improvements.
Using the water quality ladder (see figure to the right), estimate current water quality conditions prior to the project. For example, if a water body is currently acceptable for rough fishing and provides satisfactory habitat for some wildlife, it would receive a rating of 4.3. The table shown below the water quality ladder can help to inform these judgements.
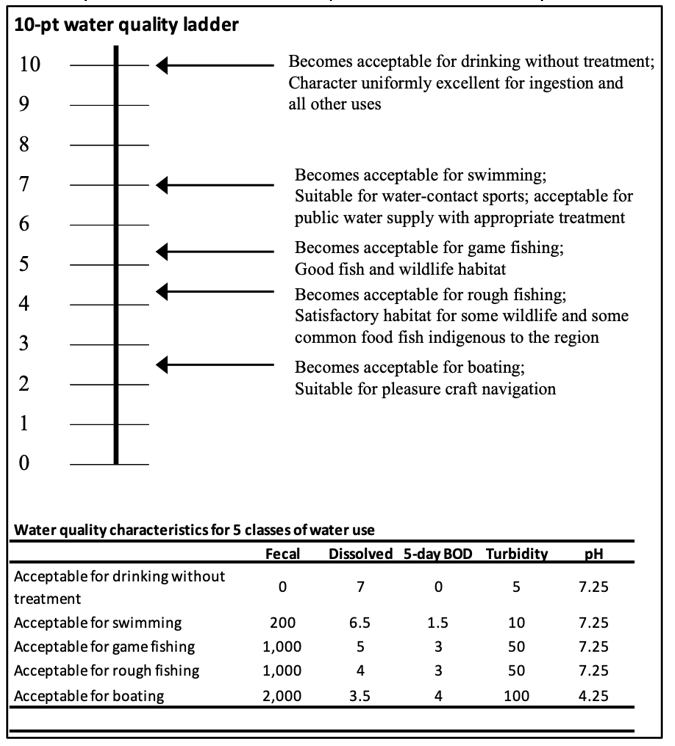
Next, based on the expected outcomes of the project, estimate the extent to which the green infrastructure project or nature-based solution will improve water quality for the area it impacts, and the number of points that this improvement will represent. For example, if the project was expected to improve water quality from a 4.3 to a 5.3 on the water quality ladder, the expected improvement would be 1 point.
Step 2: Estimate household willingness to pay for water quality improvements
The WRF Green Infrastructure TBL Tool requires the following inputs to estimate household WTP for water quality improvements, including:
-
-
- Whether the water quality change occurs in an estuary
- Whether the water quality change affects only local freshwater bodies (i.e., those within a city or a small portion of a state) – this should be a “Yes” for the types of projects covered here.
- State in which the project is located
- Median household income for the local area (deflated to 2010 dollar value)
- Whether the affected water body supports recreation, and if so, the percent of affected population that use the resource for recreation
-
Step 3: Scale total value to estimate benefits of individual project
The next step is to scale the percentage of total WTP or households that should be included in the calculation of for the project(s) being analyzed. This will vary depending on the nature and scale of the project but can be determined in several ways. For example, the user may base it on the percentage of total stream miles affected in a watershed or the percentage of a total stormwater management goal that the project helps to meet (e.g., number of greened acres, percentage of uncontrolled impervious acres treated, percentage of total costs necessary to meet TMDL requirements or a city’s stormwater management goals). The green infrastructure TBL Tool calculates the total value of water quality improvements by multiplying average household WTP by the number of households and the “percent project contribution” values entered by the user.
Resource and guides
Water Research Foundation (WRF) Green Stormwater Infrastructure Triple Bottom Line Tool (Green Infrastructure TBL Tool) is one of the easiest ways to calculate the value of water quality benefits in this context. The tool requires inputs for water quality baseline point value and point improvements, recreational usage estimates, percentage of improvements to estuaries, household median income, and the number of households impacted.
The US Census Bureau American Community Survey (ACS) data contains household level information that can be used as WRF Tool inputs. Necessary information can be found in a Census area’s location profile, which are one of the first results when searching for a place. Alternatively, ACS tables “B19013” and “CP04” contain data on median household income and total households, respectively. Applying the impacted location as a filter on the Census data website yields the data for the relevant location.
Recreation
Green infrastructure and other nature-based solutions can increase and/or improve community recreational opportunities by adding green space and improving access to recreational amenities such as pathways, bike paths, and functioning ecosystems. Intentionally creating parks or integrating recreational amenities into nature-based projects can provide valuable benefits for residents and visitors. Habitat improvements that attract birds and other local wildlife also provide unique recreational opportunities. In more urban settings, green infrastructure projects that increase vegetation can enhance community aesthetics and reduce urban heat; this in turn can lead to greater participation and enjoyment of outdoor activities.
Overview and information needed
Quantifying the recreational benefits of nature-based resilience projects requires knowledge of the types of recreation available at a site, current visitation levels (if the site currently supports recreation), and a project’s ability to increase recreational opportunities, use, and enjoyment.
Recreational visits are associated with a person’s WTP to participate in a recreational experience, also referred to as a direct use value. This value reflects the quality and enjoyment associated with a recreational experience, and can vary by activity type. Direct use values represent WTP per visit to participate in a recreational activity.
The total value of recreation at a given site is a function of direct use values and the recreational trips (often referred to as “user days” or visitor days) taken to the site. Factors that affect visitation and/or direct use values include the type and quality of recreational amenities available at a site, the availability of similar recreational opportunities nearby, characteristics and proximity of residents, ease of access, and the aesthetic nature of the site
Estimating benefit values
Estimating the economic benefits of recreational amenities is a three-step process.
Step 1: Estimate the number of new recreational users by activity type
Recreational benefits depend on the number of new recreational visits to a site each year, as well as the primary activities in which visitors participate.
For sites that currently support recreation but where the proposed project will increase or enhance recreational opportunities, increases in recreational use may reflect an increase in the frequency of visits by existing users and/or the addition of new users. For projects that will create new recreational opportunities, most visits may be considered “new visits.” However, the number of new visits may need to be adjusted downwards if there are several similar recreational opportunities nearby (i.e., in this case, some visits may be a transfer from one site to another rather than a true net gain in recreational visits).
The WRF Green Infrastructure TBL Tool contains a module that allows users to estimate visitation to neighborhood “pocket parks” and to larger parks. Local planning documents and data can also provide insights into a site’s existing recreational use. Planners can use this information to evaluate the impact of an assumed percentage increase in existing visitation. In absence of sufficient data, rules of thumb can be applied to estimate visitation. A project’s proportional impact may be useful a proxy for estimating the increase in recreational opportunities. For example, if a project increases total green space in a neighborhood by 10%, it can be assumed that the project generates a 10% increase in community recreation. Visitation may also be estimated based on assumptions regarding the average number of visits per year by households located within a certain distance of the area.
Relatively simple information regarding participation by activity type is needed at this stage. Specifically, if a site offers fishing, hunting, boating, or a specialized activity, the percentage of visitors that participate in these activities should be estimated. All other activities can be considered “general recreation” for the purposes of valuation.
Step 2: Determine direct use values
It can be challenging to determine direct use values, as original estimates rely on stated preference surveys and/or revealed preference studies. In some cases, local or state studies may report direct use values for different activity types. These values can be applied using benefits transfer to estimate the value of recreation associated with a project.
When local data is unavailable, the US Amy Corps of Engineers (USACE) Unit Day Value method can be used to estimate direct use values. This method allows users to calculate values for general recreation, fishing and hunting, and specialized recreation activities based on site characteristics. It can be used to estimate differences in direct use values for projects that enhance recreational opportunities and/or quality at existing recreational sites, as well as for projects that create new recreational opportunities.
The Oregon State Recreation Use Values Database is another potential resource for direct use values. It provides national and regional values for specific recreational activities.
Step 3: Calculate project benefits
In this step, multiply the number of new recreational user days by activity type (i.e., number of new visits relative to the baseline) by the corresponding direct use value to calculate the project’s total recreational benefits.
Resources and guides
Water Research Foundation (WRF) Green Stormwater Infrastructure Triple Bottom Line Tool (Green Infrastructure TBL Tool) utilizes the USACE methodology for estimating direct use values associated with recreational opportunities generated by green infrastructure projects. It also helps users estimate visitation to community parks, pocket parks, and wetland areas, and recreation associated with general neighborhood greening. The methodology employed is applicable to both small and larger scale nature-based projects that create or enhance recreational sites.
US Amy Corps of Engineers (USACE) Unit Day Value method can be used to estimate direct use values.
Wildlife Habitat and Biodiversity
Green infrastructure and other nature-based resilience projects can provide habitat and biodiversity benefits by integrating natural elements into urban environments. Practices such as rain gardens, green roofs, bioretention facilities, and wetlands create new habitat and/or improve the quality of existing ones, offering food and refuge for a variety of species including birds, amphibians, bees, and butterflies. These installations can also enhance landscape connectivity, facilitating the movement of mobile organisms, essentially creating wildlife corridors.
By improving water quality, reducing peak flows, and recharging aquifers, green infrastructure can also support aquatic ecosystems. Aquatic habitat benefits can be valued based on household WTP for water quality improvements, as described in the water quality benefits section.
Overview and information needed
The value of habitat improvements can be difficult to quantify because habitat and biodiversity are generally not bought and sold in a market. As result, quantifying this value depends on the methods economists have developed for valuing “non-market” goods and services. For example, stated preference methods use advanced survey techniques to elicit estimates of WTP for specified improvements in – or avoided degradation of – habitat or water quality, based on the species affected, nature of the improvements, and other local factors. Units are typically in terms of WTP per household or totaled to produce total WTP per acre of habitat.
The simplest approach for valuing habitat is to apply per acre values to the new or restored habitat area. This requires information on the project size/footprint, type of vegetation/land use, and applicable WTP values. In some cases, a project might benefit a key species, including a threatened or endangered species. In these cases, studies may be available that report higher values for WTP due to the unique nature of the site. To estimate these values, practitioners can search academic literature to find applicable benefit transfer values (see description of Ecosystem Values Reference Inventory, EVRI, below).
Estimating benefit values
High level habitat values can be estimated using benefit transfer of published per acre habitat value. Follow the steps below to estimate benefits to wildlife habitats and biodiversity.
Step 1: Define the habitat area/type
The first step is to determine the new or restored area of habitat, the type of habitat/and use, and key species that could potentially benefit from the project. When restoration occurs over existing habitats, the impacted area may be estimated based on a percentage of total restored land, the extent of improvements, and prior degradation. This requires some professional judgement.
Applying per acre habitat values is the simplest approach and more accurately reflects aggregate WTP by all households. However, some projects may be more unique in that they provide habitat for highly values species (e.g., threatened or endangered species). Studies may be available that estimate WTP per household for providing habitat for these species. To apply these studies, an estimate of the number of households located within a certain distance of the project is necessary. The distance will depend on the scale of the project and may be determined from the study being relied on for benefit transfer estimates. This approach would require some professional judgement.
Step 2: Apply WTP values
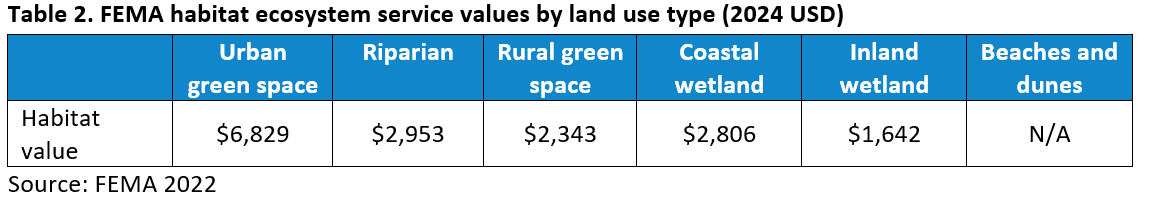
The next step is to determine the applicable WTP values for the project. Two key sources can be used. The FEMA Benefit Cost Analysis Toolkit (BCA Tool) is an Excel-based tool that is publicly available for use. The tool helps users assess ecosystem service benefits associated with nature-based flood mitigation actions based on the land use types associated with their project (e.g., urban green space, wetlands). The tool values ecosystem services across four categories (consistent with the widely recognized ecosystem services classification framework) and for 14 subcategories. Values taken from academic literature are applied to each subcategory by land cover type, resulting in dollar per acre estimates. Table 2 shows values for the habitat subcategory for relevant land use categories. For urban green space, FEMA also reports a pollination value of $406 per acre per year (2024 USD). This can be added to the habitat value.
Another resource is the WRF green infrastructure TBL tool, which provides national average estimates for different green infrastructure types (Table 3). The values in the Tool are based on existing research related to wetlands and a relative comparison of the habitat values associated with other green infrastructure practices.

Rare habitat or habitats that provided unique ecological benefits can have higher WTP values associated with their protection. Teams determining the WTP for ecosystem restoration and improved biodiversity should note the higher WTP values for habitats such as estuaries, sea turtle nesting dunes, spawning streams, and other rare or endangered ecosystems.
Resources and guides
Water Research Foundation (WRF) Green Stormwater Infrastructure Triple Bottom Line Tool (Green Infrastructure TBL Tool)contains a module for valuing habitat and biodiversity benefits associated with green infrastructure practices and projects.
FEMA Ecosystem Service Values (June 2022) provides ecosystem service values for a range of categories, including habitat and pollination, by land use type.
Environmental Valuation Reference Inventory (EVRI) is a searchable database of summaries of environmental and health valuation studies. The EVRI is a Canadian-run resource that provides information on the economic value of environmental benefits and human health effects. The database includes summaries of over 5,000 valuation studies, with information on the study location, the environmental assets being valued, the methodological approaches, and the estimated monetary values.
Carbon Reduction
Carbon dioxide (CO2) is a greenhouse gas (GHG) that contributes to rising atmospheric temperatures and climate change. Vegetation incorporated into green infrastructure and nature-based resilience projects removes CO2 from the atmosphere and acts as a sink by storing carbon in the form of biomass. In addition, green infrastructure practices such as trees and green roofs can save energy by providing shade and insulation to buildings. In combined sewer communities, green infrastructure projects can reduce energy demands associated with stormwater pumping and treatment. This in turn reduces energy-related emissions of CO2 and other GHGs.
Overview and information needed
Information on the amount of carbon sequestered by trees and other types of vegetation is necessary to estimate carbon reduction benefits. This varies over time and by vegetation type, and can involve complex modeling to produce precise estimates. However, average annual carbon sequestration rates (e.g., per tree or per square foot of vegetation) can be applied for the purposes of high level benefits analysis.
If a nature-based resilience project reduces energy use through building energy savings and/or avoided stormwater pumping and treatment, it is necessary to estimate the total energy savings and associated avoided GHG emissions. Emission rates from power generation depend on regional fuel resource mix and other factors. Publicly available data from the U.S. EPA reports CO2 and other GHG emission rates from electricity production (by U.S. region), in terms of pounds per MWh of electricity produced.
Economists typically value the benefits of CO2 reductions using the “social cost of carbon” (SCC), which represents the aggregate net economic value of damages from climate change across the globe. In 2016, the U.S. Government’s Interagency Working Group (IWG) on Social Cost of Carbon issued updated guidance on recommended SCC values (per ton of CO2) for regulatory benefit-cost analysis. The Working Group’s estimate reflects the worldwide net benefit of reducing one ton of atmospheric CO2, on average.
Estimating benefit values
Follow the steps below for estimating benefits of carbon sequestration.
Step 1: Estimate carbon sequestration from new vegetation
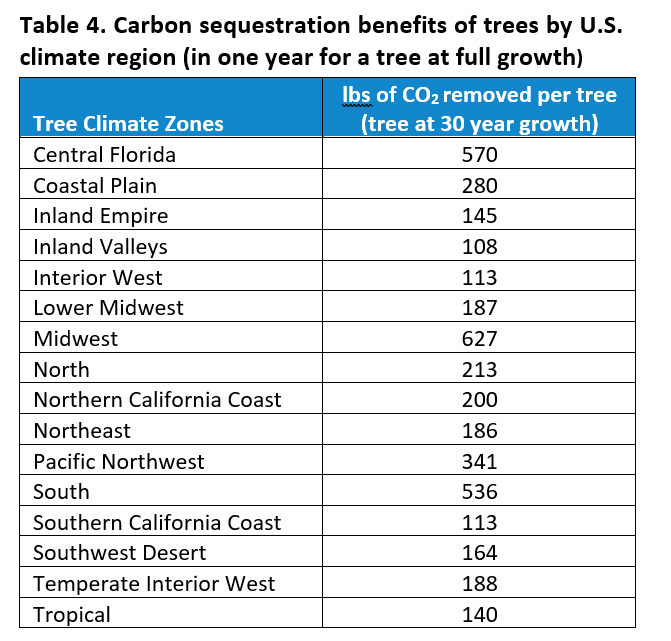
The first step is to estimate the amount of CO2 removed from the atmosphere by green infrastructure or nature-based resilience projects. Table 4 shows average annual carbon sequestration by trees for different climate regions of the U.S. (see map below).
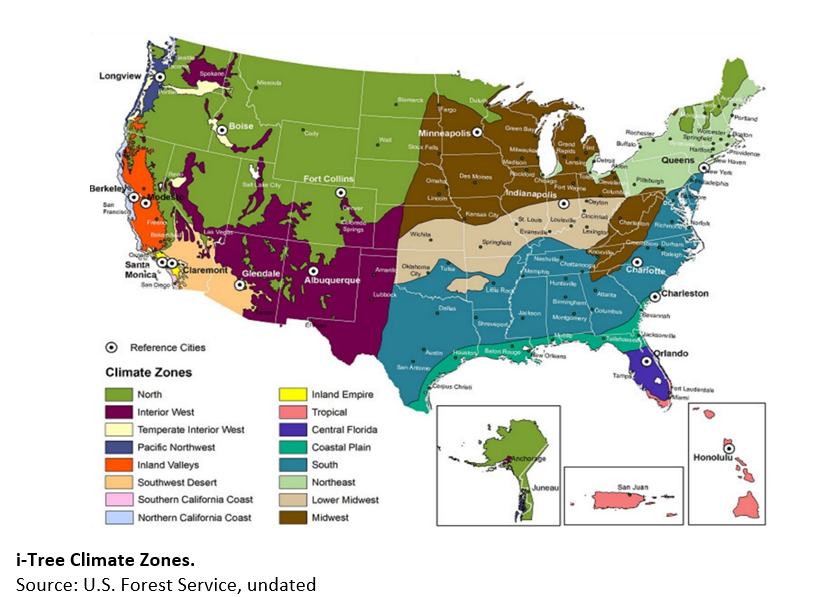
These estimates were calculated using i-Tree tools (developed by the U.S. Forest Service, USFS) and information from the USFS on the typical mix of tree species by region and their average size. They reflect the amount of carbon sequestered by trees at full tree growth (assumed to be 30 years and beyond), and have been translated from carbon (C) sequestered from the atmosphere to equivalent reductions in CO2. To estimate benefits over time, these estimates can be scaled over 30 years. A simple way to do this is to assume that a newly planted tree (year 1) would capture 10% of the amount of carbon sequestered in year 30.
Carbon sequestration rates for other types of vegetation vary. The WRF Green Infrastructure TBL Tool applies the following assumptions to estimate carbon sequestration for different types of nature-based resilience projects. These estimates can be used as rules of thumb:
- Wetlands: 0.41 kg CO2/m2 per year
- Bioretention, rain gardens, and bioswales 1.01 kg CO2/m2 per year
- Green roofs: 2.04 kg CO2/m2 per year for three years post implementation. Green roof capacity to store carbon is limited, as their soil substrate is often between 3 and 12 inches. This means that after a few years they typically reach equilibrium in terms of net carbon storage.
Step 2: Estimate CO2e emissions reductions
Building energy savings from trees and green roofs can be estimated using USFS i-Tree software and the National Green Roof Energy Calculator, respectively. Table 5 also shows energy savings from street trees by U.S. climate region (estimated using i-Tree tools and information from the USFS on the typical mix of tree species by region and their average size), which can also be used for this purpose. For combined sewer communities, the WRF Green Infrastructure TBL Tool reports national average energy use associated with stormwater pumping and treatment as 2,000 kWh/MG and 2,520 kWh/MG, respectively. These estimates can be tailored to individual projects and communities.
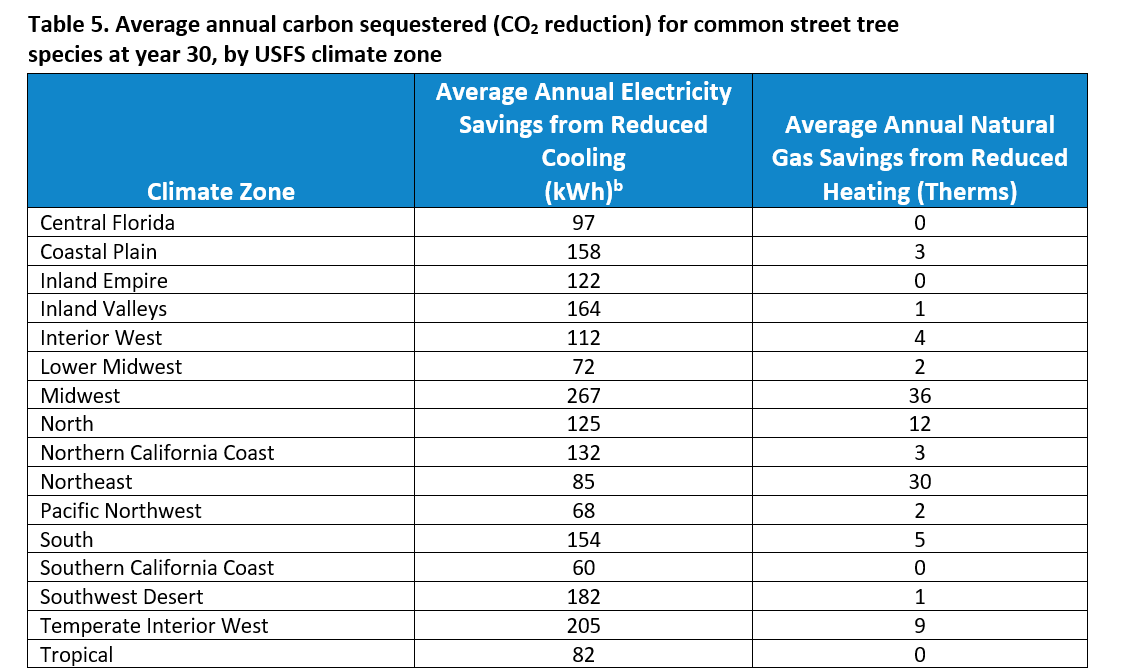
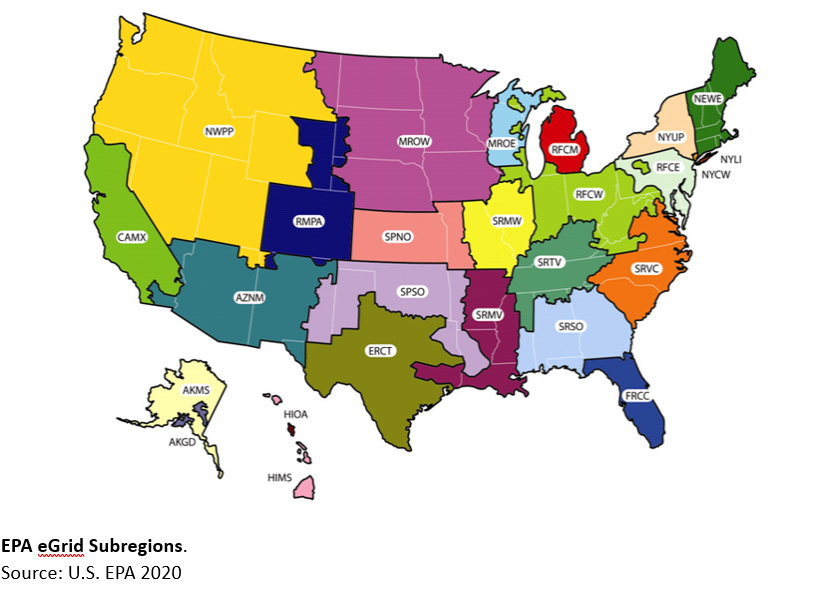
Table 6 shows emissions rates for CO2 equivalents (which translate all GHGs into an equivalent CO2 unit). It also shows average electricity grid loss percentages. This data is published by the U.S. EPA for different energy producing regions of the U.S., referred to as eGrid regions.
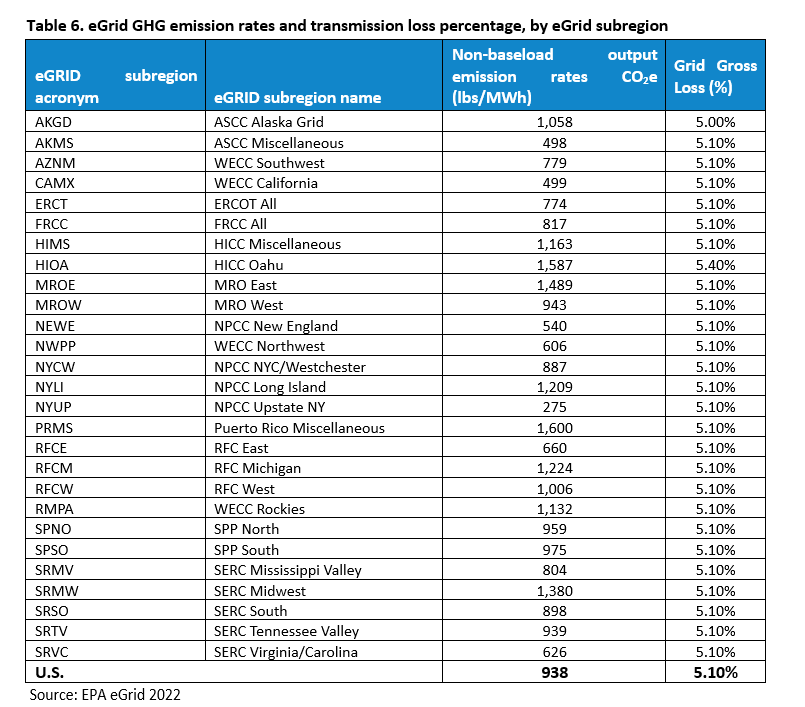
To calculate avoided emissions, multiply the avoided energy use associated with green infrastructure/nature-based resilience projects by the relevant emissions rate for the relevant eGrid subregion (see map), accounting for grid transmission losses. For example, an energy savings of 5 MWh per year in the ASCC Alaska Grid (AKGD) would be multiplied by the corresponding avoided emission rate of 1,058 lbs/MWh, and again by the transmission loss rate of 5.00% plus 1. This yields an estimate of 5,555 lbs of CO2eemissions avoided per year (5 MWh * 1,058lbs/MWh * 1.05 = 5,555 lbs CO2e).
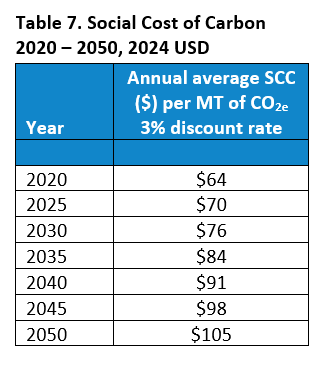
Step 3: Value carbon reductions using Social Cost of Carbon
The final step is to apply the SCC to estimate the monetary value of carbon reductions each year. Table 7 shows SCC estimates for different years, reported in 2024 USD (in present value terms, assuming a discount rate of 3%). Increases in the SCC in later years are above and beyond inflation; this is because increased damages will occur from carbon over time as population grows and damages become cumulative. While the table shows SCC estimates in 5-year increments, values can be interpolated for intermittent years.
Resources and guides
Water Research Foundation (WRF) Green Stormwater Infrastructure Triple Bottom Line Tool (Green Infrastructure TBL Tool) contains a module that allows users to calculate the carbon reduction values associated with various green infrastructure practices.
i-Tree is a software suite developed by the USDA Forest Service that allows users to estimate the full range of benefits provided by trees and forests. It calculates carbon and pollution reduction benefits from trees and energy savings, in addition to other benefits. Depending on the module, users input tree characteristics, lifespan, and project details to place tree projects in a specific area.
National Green Roof Energy Calculator is an online tool that allows users to estimate the energy savings and other benefits of green roofs in 100 U.S. cities.
Economic Development
Larger nature-based projects, green streets, and/or projects that distribute green infrastructure across or neighborhoods can enhance community aesthetics, spur economic development, and support community cohesion.
Overview and information needed
Economic benefits to businesses
Greening multifamily residential buildings, shopping areas, and commercial corridors can increase neighborhood aesthetics, which in turn can increase rental rates and retail sales. Several studies have found that green infrastructure and similar nature-based improvements attract more customers, enhance customer experiences, and create reputational value for the business.² Studies looking at the effect of greening urban business districts and strip malls have concluded that consumers are willing to pay a premium on products, visit stores and restaurants more frequently, or travel farther to shop in areas with attractive landscaping, good tree cover, or green streets.³
Community enhancements and economic development
Nature-based resilience projects can provide significant quality of life and neighborhood improvement benefits when specifically designed for this purpose. For example, programs that pair stormwater management opportunities with vacant lot revitalization, community gardens, safe routes to schools, or neighborhood parks and green spaces can result in multiple benefits for residents, including human health benefits, community cohesion, and improved economic vitality. Larger-scale green infrastructure projects such as stream restoration or other projects that create recreational opportunities can attract new businesses, spur investments, and provide recreational opportunities that attract visitors.²
Value of neighborhood improvements
The value of nature-based improvements for local businesses and residents are often reflected in increased property values or rental rates, and/or enhanced economic activity (e.g., increased economic output or sales). The documentation associated with the WRF Green Infrastructure TBL Tool reports that well designed nature-based solutions can increase single family home values by as much as 7% to 12%, depending on the type of improvement, but that most estimates seem to range from 1% to 5%.
A study published by the Natural Resources Defense Council (NRDC) reports the following benefits from green infrastructure projects for office buildings, multi-family residential buildings, and retail centers based on the following estimates from the literature:
Economic multipliers or more comprehensive economic impact assessments (EIAs) that rely on input-output models can be used to examine the impact of increased economic activity within a region. These are described in more detail below.
- Multi-family residential property values increase from 2% – 5%
- Shade & landscaping increase rental rates for office buildings by 7%
- Rents in multifamily residential buildings with green roofs can be upwards of 16%, but typically within the range of 7% -10%
- Shoppers willing to pay 8% – 12% higher prices for shopping in areas with tree canopy
Economic multipliers or more comprehensive economic impact assessments (EIAs) that rely on input-output models can be used to examine the impact of increased economic activity within a region. These are described in more detail in the next section.
Estimating benefit values
Community enhancement benefits (measured through increased property values)
To measure the value of aesthetic improvements associated with nature-based solutions and green spaces, economists typically employ “hedonic pricing” methods, which use statistical analysis to estimate the effect of different factors on the price of a home or property. Hedonic models attempt to isolate the effect of a specific characteristic, such as proximity to green infrastructure, on a property’s market value by controlling for all other factors. Developing hedonic models to assess property value increases is a time-consuming and resource intensive task. For a high level benefits assessment, practitioners can apply findings from existing well-executed studies on this topic. This approach is known as benefits transfer. The following describes key steps and considerations for applying benefits transfer in this context.
Step 1: Identify the properties affected by the project.
This step involves applying professional judgement to identify the properties that would likely realize an increase in value because a green infrastructure or other nature-based resilience project is located nearby. Factors to consider include the scale of the green infrastructure project, the level of existing green space, landscaping, and/or tree canopy in the area, and any amenities provided by the project. For example, a green roof or rain garden located on a property might influence only the value of that property, while a green street or public open space would have a much greater impact, including for adjacent properties and beyond. In evaluating the effect of distributed green infrastructure, a study conducted in Philadelphia found property value increase for projects located within a quarter mile of green infrastructure improvements.
Step 2: Estimate the property value baseline for single family residential multi-family properties.
This information can be obtained from the American Community Survey (ACS), at the city or even Census tract level. The WRF Green Infrastructure TBL Tool offers a methodology and specific instructions for accessing and applying this data. Alternatively, many utilities may have access to more comprehensive local databases, such as through the County Assessor’s office that will allow them to calculate baseline residential and commercial property values. Online tools such as Zillow, which estimates home sale prices can also be used to estimate baseline property values.
Step 3: Apply property value increases from the literature to the aggregate value of affected properties.
The percent property value increase that might be expected from a nature-based resilience project(s) also requires some level of professional judgment. As in Step 1, factors include the type and scale of the project, the level of existing green space, landscaping, and/or tree canopy in the area, and any amenities provided by the project. Table 8 provides a range of estimates from the literature for property value increases associated with different types of nature-based practices.
Table 8. Range of property value increases from green infrastructure and nature-based practices, based on literature review of hedonic studies
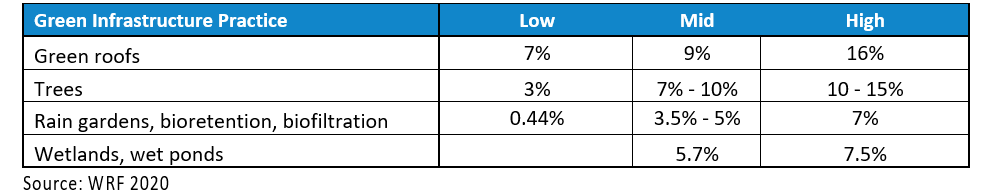
As an important note, the property value increases associated with nature-based projects can reflect WTP for a range of benefits. Thus, property value increases are also likely capture other project benefits, such as related to recreation or flood risk reduction. As a rule of thumb, applying 50% of total property value benefits when summing benefits across categories can help to avoid double counting.
Economic impacts
Economic multipliers or more comprehensive EIAs can be used to examine the impact of increased economic activity within a region. For example, an EIA can estimate how increased visitor spending associated with an improved recreational site flows through the local economy, creating positive economic output and employment impacts. These same methods and tools can be used to estimate the effects of value added development or increased retail that occurs within a city or town because of a comprehensive nature-based project.
To estimate the economic impacts associated with a resilience project, a team can utilize state- or local- (e.g., County) level economic multipliers (e.g., published by the Bureau of Labor Statistics and the Bureau of Economic Analysis) or more comprehensive input-output models such as IMPLAN ,which is available (for purchase) for every county in the U.S. Multipliers and input-output models capture the ripple effects associated with increased economic activity in a local region, including direct, indirect, and induced impacts. For example, a resilience project that increases recreational opportunities and attracts visitors from outside the region, results in increased tourist spending (direct effects). Businesses that benefit from this increased spending purchase supplies from other local industries (indirect effects). Households employed by impacted businesses and industries benefit from this additional activity and often spend more money (in aggregate) in the local economy as employment increases (induced effects). Economic impacts are different than economic benefits (as they represent a transfer). Economic impacts (and particularly indirect and induced effects) should not be added to economic benefits used for benefit cost analysis purposes. Use of multipliers and input-output models typically require some level of expertise with EIA concepts to ensure the methodology is correctly applied.
Resources and guides
Water Research Foundation (WRF) Green Stormwater Infrastructure Triple Bottom Line Tool (Green Infrastructure TBL Tool)contains a module that helps users quantify the property value increases associated with green infrastructure projects, walking users through data sources and key considerations for applying benefits transfer in this context.
IMPLAN is a cloud-based economic input-output model that allows users to calculate economic impact assessments at various scales. Data and modeling is available for all counties within the U.S. for purchase.
Green Infrastructure Impact Hub Guide to Understanding and Monetizing the Job Creation and Economic Development Benefits of Green Stormwater Infrastructure (2024).
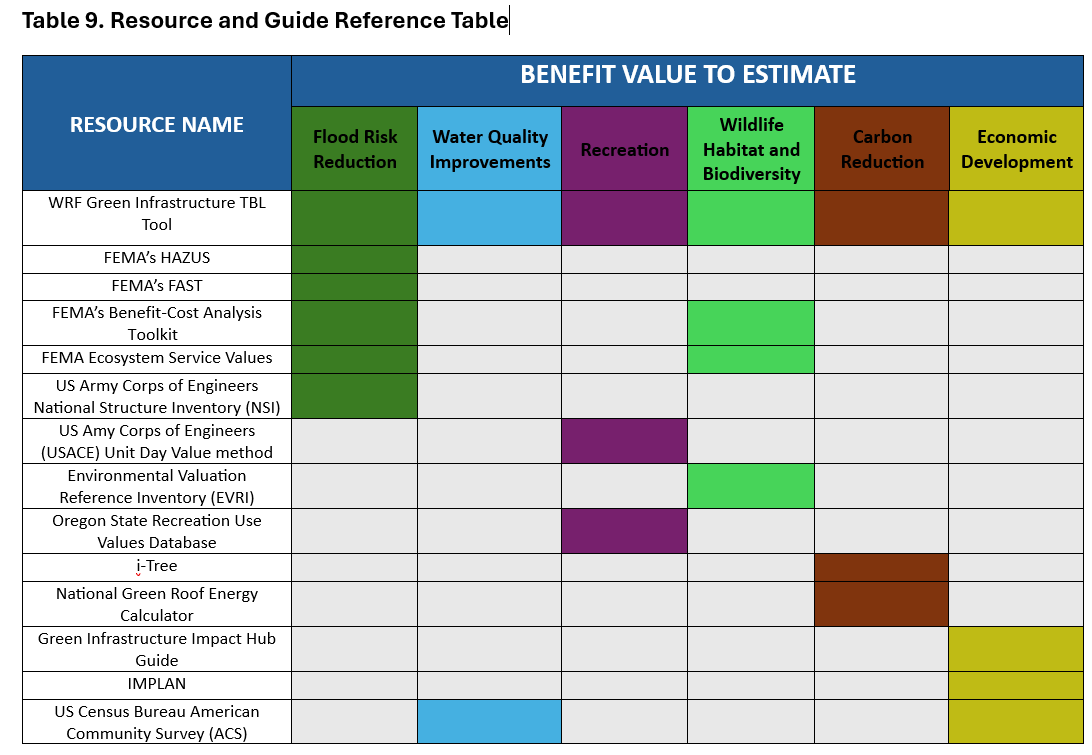
Resources and Guides for Valuing Green Infrastructure Benefits
The following resources and guides are referenced in the sections above for quantifying environmental and economic benefits of green infrastructure practices. Table 9 organizes the resources for easy comparison to estimate a specific benefit value. View the complete list of resources and guides below.
Resource Links:
Water Research Foundation (WRF) Green Stormwater Infrastructure Triple Bottom Line Tool (Green Infrastructure TBL Tool) is an Excel-based benefit-cost assessment tool that allows users to quantify the financial, social, and environmental benefits of green infrastructure solutions. The green infrastructure TBL Tool contains a module that allows users to estimate the avoided infrastructure costs associated with more traditional gray infrastructure projects for stormwater management, including projects that reduce flood risk and improve water quality.
Federal Emergency Management Agency (FEMA) tools for estimating benefits of flood risk reduction projects:
- HAZUS, managed by FEMA’s Natural Hazards Risk Assessment Program provides standardized tools and data for estimating risk from earthquakes, floods, tsunamis, and hurricanes. Hazus software is distributed as a GIS-based desktop application with a growing collection of simplified open-source tools.
- FAST, Flood Assessment Structure Tool rapidly analyzes building-level flood risk using the Hazus flood model methodology.
- Benefit-Cost Analysis Toolkit method that determines the future risk reduction benefits of a hazard mitigation project and compares those benefits to its costs. FEMA requires that hazard mitigation projects be cost-effective to the federal government; therefore, the project must demonstrate a Benefit-Cost Analysis (BCA) that compares the net present value of a project’s future benefits and costs.
- Ecosystem Service Values (June 2022) provides ecosystem service values for a range of categories, including habitat and pollination, by land use type
US Army Corps of Engineers (USACE):
- National Structure Inventory (NSI), a repository of structure point data containing building-level attributes in a GIS base layer that can be used for this purpose. (NSI) includes information about the location, type, and value of buildings and infrastructure.
- US Amy Corps of Engineers (USACE) Unit Day Value method can be used to estimate direct use values.
Environmental Valuation Reference Inventory (EVRI) is a searchable database of summaries of environmental and health valuation studies. The EVRI is a Canadian-run resource that provides information on the economic value of environmental benefits and human health effects. The database includes summaries of over 5,000 valuation studies, with information on the study location, the environmental assets being valued, the methodological approaches, and the estimated monetary values
The Oregon State Recreation Use Values Database is Excel workbook that identifies more than twenty-one activity types based on recreation use value estimates measured by the net willingness-to-pay or consumer surplus for recreational access to specific sites, or for certain activities at broader geographic scales (e.g., state or province, national) in per person per activity day units.
i-Tree is a software suite developed by the USDA Forest Service that allows users to estimate the full range of benefits provided by trees and forests. It calculates carbon and pollution reduction benefits from trees and energy savings, in addition to other benefits. Depending on the module, users input tree characteristics, lifespan, and project details to place tree projects in a specific area.
National Green Roof Energy Calculator is an online tool that allows users to estimate the energy savings and other benefits of green roofs in 100 U.S. cities.
IMPLAN is a cloud-based economic input-output model that allows users to calculate economic impact assessments at various scales. Data and modeling is available for all counties within the U.S. for purchase.
Green Stormwater Infrastructure Impact Hub houses an expansive range of resources valuing the multiple benefits of GSI to support practitioners, advocates, policymakers, and leaders.
GSI Impact Calculator that was developed to address the growing need for credible information about sustainable, cost-effective stormwater management solutions in urban areas. The Calculator provides a comprehensive analysis of potential GSI projects, allowing users to input specific data and customize scenarios to reflect local conditions.
The US Census Bureau American Community Survey (ACS) data contains household level information that can be used as WRF Tool inputs. Necessary information can be found in a Census area’s location profile, which are one of the first results when searching for a place. Alternatively, ACS tables “B19013” and “CP04” contain data on median household income and total households, respectively. Applying the impacted location as a filter on the Census data website yields the data for the relevant location.
Economic Valuation Approaches
A challenge in valuing the benefits of GSI and other nature-based solutions is that many of the ecosystem services they provide (e.g., improved water quality, enhanced recreation) are generally not bought and sold in a market and therefore do not have a directly observable market price. Economists have developed several methods for valuing these “non-market” goods and services and other ecosystems service benefits. Common valuation methods include stated and revealed preference methods, which are used to value non-market benefits, and avoided cost analysis and production-based approaches, which rely on market prices and outcomes.
Benefits transfer methods
Benefits transfer is a research approach that relies on estimates of existing economic values in one context to estimate economic values in a different context. There are numerous challenges and cautions to consider when using benefits transfer, however, when implemented correctly, with the recognition that the estimates are not intended to be precise, benefits transfer is accepted as a suitable method for estimating non-market benefits in various contexts.
Benefits transfer is commonly used in economics, and there is a well-developed literature on how to correctly apply this method. Primary approaches, described in the sections below, rely on data generated by the authors and typically require a significant amount of time, expertise, and financial resources. For this reason, researchers often use the benefits transfer approach to estimate non-market values.
Stated Preference Methods
Stated preference methods rely on survey questions that ask individuals to make a choice, describe behavior, or state directly what they would be willing to pay for the non-market good or service being evaluated. Stated preference methods are based on the notion that there is some amount of market goods and services that people would be willing to trade off so they can benefit from a non-market good. This is often measured in terms of willingness to pay (WTP). An advantage of stated preference methods is that they include the ability to estimate both use values and non-use values.
Revealed preference methods
Revealed preference methods rely on choices people make in related markets to infer the value of a nonmarket good or service. The most common revealed preference methods are the hedonic pricing, travel cost, and averting behavior methods. Hedonic methods use statistical analysis to estimate the influence of different factors on observed market prices. For example, researchers often cite hedonic studies that infer the value of resilience activities by comparing price differences between properties that have incorporated habitat or environmental functionality improvements (or that are located close to such improvements) and those that have not.
Avoided cost methods
Avoided cost analysis determines the marginal cost of providing an equivalent service in another way. For example, reducing potential stormwater volume discharged to a municipality’s storm sewer infrastructure can avoid costs associated with repairing that system, and/or reduce the size of concrete pipe needed during upgrades. Similarly, in areas where resilience projects can reduce the risk of future flooding, this can offset (or delay) the need to undertake flood damage repairs. Avoided costs should only be used to measure benefits when they would be incurred in absence of the planned resilience scenario.
Production function approaches
Production function approaches value environmental goods and services based on their impact on production. They are based on the idea that environmental attributes can affect a sector’s production function, and that the effect on production can be valued at market prices. For example, high quality nature-based recreation sites can positively affect economic output associated with tourism.
Key Steps and Considerations
This following provides a framework that water utilities and municipalities can use to better understand and assess the co-benefits of resiliency investments.
Establish a baseline
Defining the baseline scenario is a critical first step to conducting a comprehensive economic analysis; it is often the key to revealing the benefits of a project or program. Establishing a baseline requires analysts to identify what would occur if the planned project were not implemented. In some cases, impacts will continue into the future if no action is taken to address the identified problem. However, baseline conditions may also reflect a future in which an alternative project is implemented. For example, for a stormwater manager who is planning to implement a green infrastructure project to reduce the risk and costs associated with localized flooding, the baseline scenario may include costs associated with more traditional (e.g., “gray” infrastructure) flood control options, such as upgrading portions of existing drainage networks to accommodate larger storm events.
Identify a project scenario for evaluation
The next step is to establish a project scenario for evaluation. Different types of green infrastructure and other nature-based practices result in different types and levels of benefits, as does the scale of implementation. Additional factors, such as study area population, climate, and other community characteristics also affect the types and level of benefits provided. Basic information on the project site and surrounding area, as well as project design and engineering, is necessary for estimating costs and identifying and quantifying key benefits.
For a green infrastructure project, information needed at this stage might include the number, size, general location, and types of green infrastructure practices that will be implemented, the project’s stormwater capture design capacity, and total annual average runoff captured. Information on additional site amenities (e.g., recreational amenities) and characteristics of the overall project area and surrounding population also help to characterize the benefits of a project.
Identify relevant costs and benefits for the analysis
Having identified a scenario to evaluate, the next step is to characterize the costs and benefits associated with the proposed project. This includes costs and benefits beyond those faced by the utility or municipality alone. In other words, all benefits and costs should be counted, regardless of to whom they may accrue, or where they might be realized.
When compiling costs, it is important to think about the overall lifespan of the project, including initial design and construction costs and maintenance and replacement costs over time. When identifying benefits, it is important to think about financial benefits that accrue directly to the utility or municipality, as well as environmental and social outcomes that benefit the broader community. Financial benefits to a utility may include costs associated with an alternative project that is avoided compared to the baseline. Environmental benefits of green infrastructure and nature-based projects may include expanded and/or higher quality habitat, improved water quality, and/or carbon reduction. Social benefits may include enhanced recreational opportunities, flood risk reduction, public health improvements associated with better air quality and reduced urban temperatures, green job creation, and/or neighborhood beautification.
Once all costs and benefits are identified, they can be evaluated to determine which must be qualitatively described (e.g., because quantification is not feasible), and which can and should be quantified. It may be useful to exclude benefits that have a large degree of uncertainty associated with them, are small and somewhat insignificant (i.e., they may not be worth quantifying), or that are politically or culturally sensitive.
Quantify and monetize benefits and costs
The first step to valuing a benefit or cost is to establish the physical quantities or outcomes associated with it. Physical outcomes associated with the benefits of green infrastructure or resilience projects may include, for example, miles or acres of beach erosion prevented, reduction in water pollutants achieved, pounds of air pollutants avoided or the number of recreational user outings enabled by enhanced natural amenities or water quality. These metrics serve as the initial step in the valuation process; it is therefore important to match the quantity units of measurement to whatever metric is available for the corresponding dollar values. In some cases, these outcomes may resonate better with stakeholders compared to monetary values.
Once the physical benefits have been estimated, a per unit dollar value often can be assigned to the benefit or cost to reach a total value (quantity times per unit value). Monetary values can be estimated by applying the economic valuation methods described previously. While many can be valued using original studies, many benefits can also generally be estimated using benefits transfer techniques. For both physical outcomes and monetized benefits, ranges may be used (rather than a single point estimate) to better represent variability or uncertainty in the estimates.
Qualitatively describe key benefits and costs
It may not be feasible or desirable to express some types of benefits or costs in quantitative or monetary terms. However, it is important to describe these non-quantified benefits and costs in a meaningful, qualitative manner. Benefits and costs may be described qualitatively, in part, by using a simple scale indicating the likely impact on net project benefits. For example, impacts can be qualitatively ranked on a 5-point scale, ranging from -2 to +2, to reflect unquantified relative outcomes that span from very negative to very positive (e.g., a “-1” may signify an outcome with moderate unquantified costs, and a “+2” may represent a high unquantified benefit). These rankings should be evaluated relative to the magnitude of monetized benefits. More complex or sophisticated rankings or methods, such as multi-criteria decision analysis, can also be applied (but may not be necessary). Break-even analysis is another tool that can be used to cast qualitative benefits in context.
Compare benefits and costs over time
The benefits and costs of green infrastructure and nature-based solutions occur as a stream of values that change over time. On the cost side, these may have large upfront capital costs that are expended in the earlier years, depending on the implementation schedule; in some cases, these costs may be spread over an amortization period. Benefits typically accrue over the life of project, and in the case of some benefit categories, continue to grow over time as vegetation becomes established and continues to grow. As with costs, benefits will also vary based on the planned implementation schedule (e.g., as project elements or phases come online).
Values that occur in different time periods need to be adjusted to comparable “present values”. There are two interrelated factors to consider when comparing values from different times – inflation and the “time value of money.” When inflation is included in projecting values over time, the values are said to be in “nominal” terms. Many financial analyses are conducted in nominal dollars. However, for economic analyses, benefits and costs are normally not entered in nominal dollars. The use of “real” dollars (i.e., where no inflation rate is applied) makes analyses easier and keeps inflation-related projections from clouding the analysis.
The “time value of money” captures a social preference for a dollar today over an inflation-adjusted dollar available in the future. The annual rate at which present values are preferred to deferred values is known as the discount rate (which is like an interest rate). The Water Resources Planning Act of 1965 and the Water Resources Development Act of 1974 require an annual determination of a discount rate for Federal water resources planning.
To compare streams of value over time from different projects, the stream of values for each project is discounted to “present value” using the discount rate. If both benefits and costs are involved, the present value of the costs is subtracted from the present value of the benefits to get the net present value (NPV) of the project.
Understand and document uncertainties
Inherent in any high level economic analysis is some level of uncertainty. Uncertainties associated with estimated benefits and costs should be explicitly documented. The impact that these may have on the outcome of the analysis (e.g., in terms of their likelihood of increasing or decreasing net benefits, or an uncertain direction of change in net benefits) should be noted.
When it is possible with available data, ranges should be developed for an estimate by stating the upper and lower bounds. When bounding of an estimate is not possible, one can at least characterize uncertainty qualitatively by describing the sources of uncertainty and stating whether an estimate developed is likely to over- or under-estimate the true value.
In many cases it can be useful to explore the impact of uncertainties or key assumptions through sensitivity analysis. Sensitivity analysis involves systematically changing the value of a key input to see how it affects the outcome of the analysis. The change in results associated with the change in inputs can illuminate how important the impact of uncertainty in a particular variable is to the outcome. Sensitivity analysis is often performed by varying a particular input by equal amounts greater to and less than the current value.
Avoid double counting
Proper accounting of benefits is necessary to ensure against double counting. Benefits included in the analysis can depend on the baseline established for the project. For example, if the baseline reflects a “do-nothing” scenario, and a project will address a localized or coastal flooding problem, then the flood damages avoided by the project can be counted as a benefit. However, if the baseline includes an alternative (e.g., gray infrastructure) project that addresses the same flooding problem (and to the same extent), the benefits of the green infrastructure or nature-based project can include either 1) the avoided costs of the alternative gray infrastructure project, OR 2) the flood damages avoided by the project. Including both would be double counting. This is because the flooding problem would be addressed under both alternatives. The two alternatives can either be compared directly (e.g., by comparing flood risk reduction and other benefits of each alternative to their costs) or the avoided costs associated with the baseline project can be counted as a benefit of the green infrastructure or nature-based solution being evaluated.
The economic value of other benefits associated with nature-based solutions are generally additive, meaning they can be added together to generate a total value. However, some of the benefit categories are interconnected (and to some extent may overlap) and must be carefully evaluated to avoid double counting. One example relates to the enhanced aesthetic value that green infrastructure and other nature-based projects provide; this is often measured based on the increase in property values for properties located within a certain distance of the project. The increase in property values reflects a WTP to live near the project and the amenities it provides, such as neighborhood beautification/enhanced aesthetics. However, it may also reflect a WTP to live near the recreational amenities the project provides; thus, adding recreational benefits to the increase in property values would be double counting. As a rule of thumb for high level benefit cost analysis, consider including 50% of a project’s property value benefits when adding total benefits that might overlap with this estimate.